If you have a website or a blog then you may have heard of Google Analytics but don’t have it installed. Or perhaps you haven’t heard of it. Either way, this post is going to be perfect or you. Throughout this post, we’re going to look at Google Analytics from the absolute beginning… Let’s start with the what.

So, what is Google Analytics?
Google Analytics is a free web analytics service by Google that tracks and reports website traffic. A premium version is also available however the free version will be just fine if you’re getting started and if you’re reading this blog post then I’m going to assume you are.
Why do I need Google Analytics?
Do you have a blog or website? Yes? Then you need Google Analytics. Even if your blog or website is for personal use only, Google Analytics is worth setting up. Have you ever wondered how many people actually read your blog posts? Or perhaps you want to know where your website visitors live. Maybe you want to know how visitors are hearing about your website and what pages are the most popular. These are all questions that can be answered by installing Google Analytics. Now, let’s look at how we can get Google Analytics installed on your website.
How to set-up Google Analytics
Firstly, you will need a Google Analytics account. If you have a Google account that you use for services such as Mail, Drive, Google Calendar or YouTube, then it’s advisable setting it up under that account. Otherwise, you will need to create a new Google account.
TIP: If you are hiring a web designer to design your website then it’s likely that they will install the Google Analytics tracking code as part of the go live stage. However, it’s important that you don’t let them create your website’s Google Analytics account under their account. You should create this yourself and then grant access to your website designer or marketing agency.
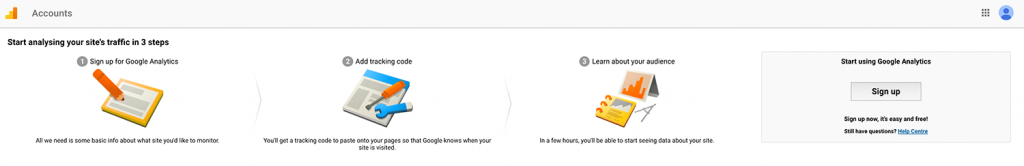
Visit the Google Analytics Home Page and click the Sign up button shown below.
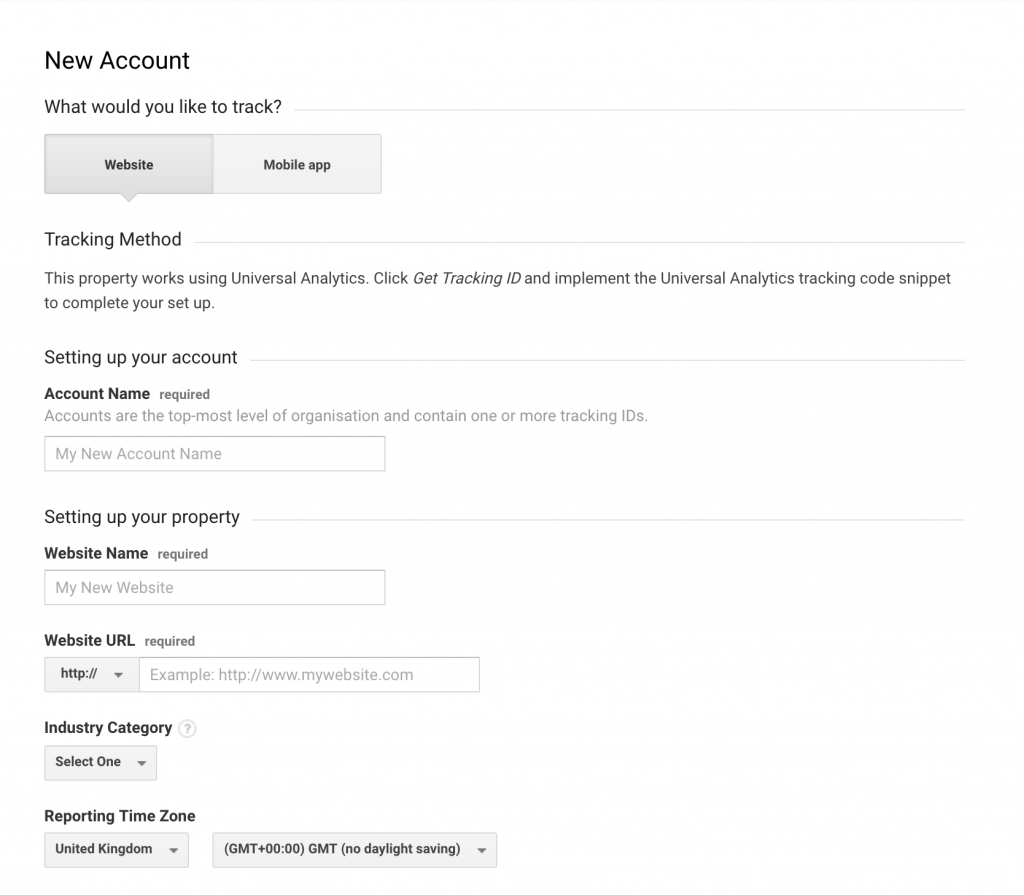
You will then be presented with a page similar to the one below where you should enter your Account Name, Website Name, Website URL, Industry Category and Time Zone. Click the ‘Get Tracking ID’ button and that’s the first part done!
On the left hand side of your screen you will see an option labelled ‘Tracking Code’ under ‘User Management’. At the top of this page you will see your Tracking ID reference that begins with UA-XXXXXXXX-X. This reference is what connects your Google Analytics account with your website. The next step is to install the tracking ID into your website.

There are 3 ways to install Google Analytics on WordPress; paste into header, functions.php and via a plugin. The plugin method is the one I would recommend, especially for beginners or those who are not familiar with coding and the back-end of WordPress. There are a vast number of WordPress plugins available however a simple one I would recommend is Insert Headers and Footers. Once installed and activated, copy and paste the Google Analytics code, not just the tracking ID, into the plugin’s settings page. It can take up to 24 hours before the stats start to show on your Google Account so don’t panic if you don’t see results straight away.
Navigating your Analytics
So you’ve waited 24 hours and the stats are starting to come in, but it’s all looking a little confusing. Well worry not, I’m here to give you a basic understanding.
AUDIENCE OVERVIEW
This is the first report you will see upon clicking on the Reporting tab. It gives a basic overview of what has happened on your site over a specified period of time. It’s great if you want to see a quick ‘at a glance’ view of your stats.
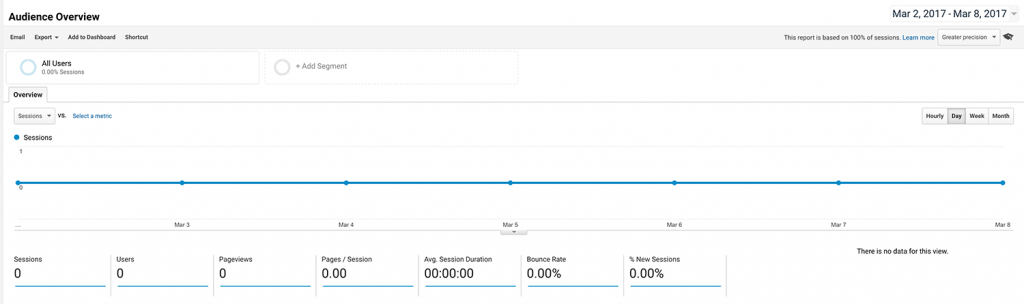
Sessions – This number is the total number of times your website was visited over a certain period of time and includes repeat visitors.
Users – This is the total number of people that visited your site during the specified time period.
Pageviews – This number represents the total number of pages that were visited during the specified time period.
Pages / Session – This is the average number of pages that were viewed per visit.
Avg. Session Duration – The average length of time that each visitor stays on your website.
Bounce Rate – This is the percentage of visitors who navigated away from your website after only viewing one page. You want to keep people on your website therefore this number should be low.
% New Sessions – The percentage of people who are visiting your website for the first time.
The default time period is one calendar month however to see your site’s analytics for a different time period, you can easily change this in the top right hand corner of your screen by selecting the dates and click apply.
REAL TIME OVERVIEW
The Real Time Overview report does what it says on the tin, shows you your website visitors in real time.
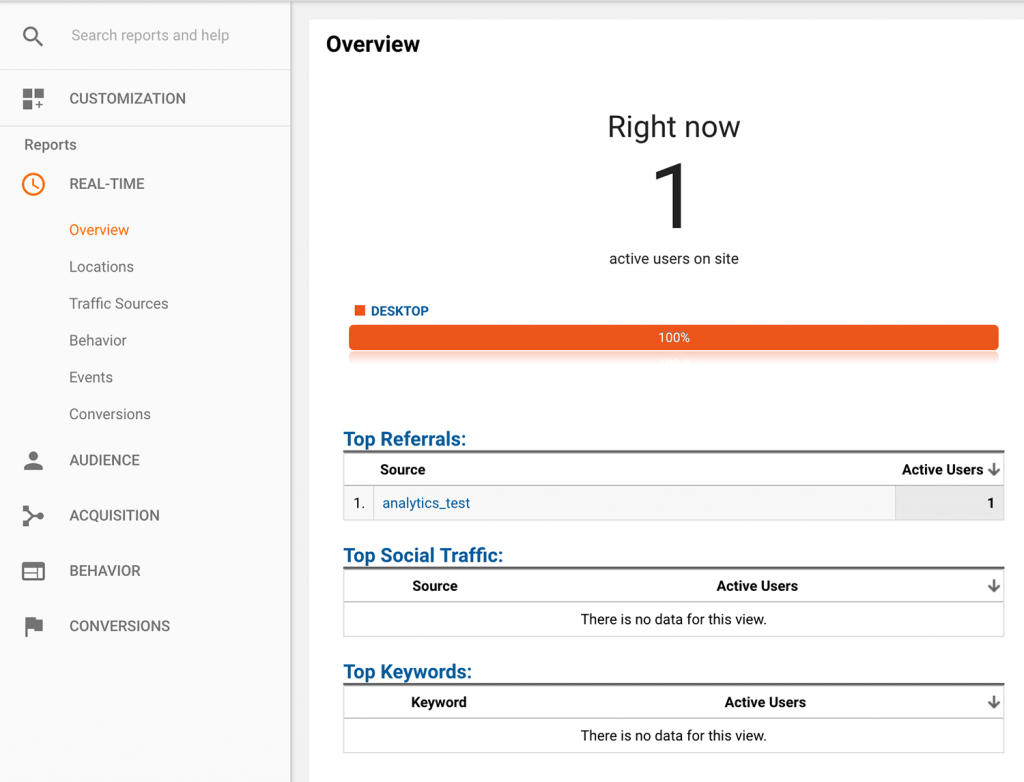
The real time report is a great way of tracking traffic after a social media update, a new blog post or after sending out an exciting newsletter to your list.
Top Referrals – Referring traffic is other websites that link back to your website and this section of the report will show this information.
Top Social Traffic – See what social media platforms are bringing traffic to your website at that particular moment.
Top Active Pages – This show’s the pages that your website visitors are currently on.
Top Locations – View where your active website visitors are located.
Top Keywords – See what visitors are typing into Google to land on your website.
ACQUISITION OVERVIEW
This report shows where your traffic is coming from and it is broken down into Social, Direct, Referral and Organic Search. If you are running a Google AdWords campaign then it will show data for this also.
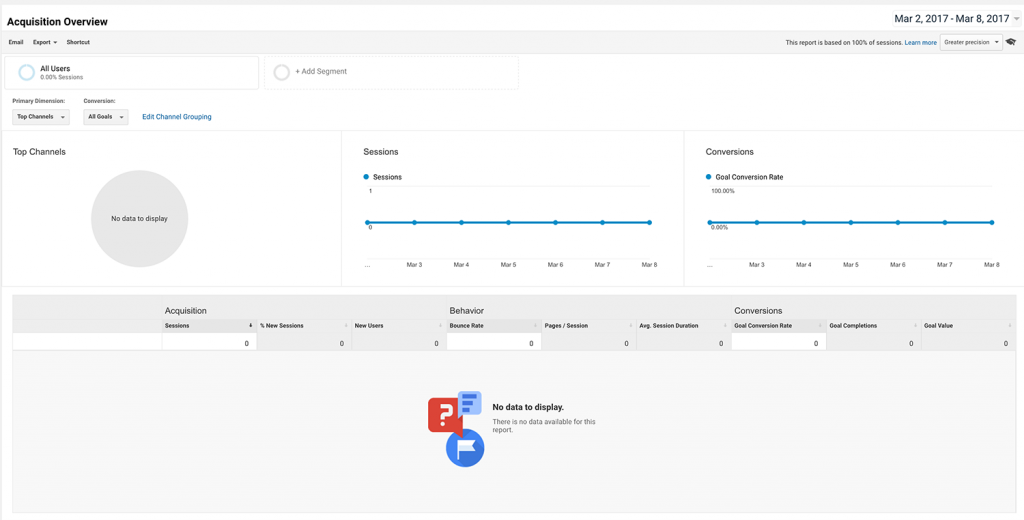
Social – The number of click throughs to your website from various social media platforms. This will not include instagram as these are counted as direct links.
Direct – This is the number of visitors that know your website URL and type it into their browser directly.
Organic Search – These are visitors that have arrived on your website via search engines. Viewing this data in more detail will show the keywords that are bringing visitors to your website and the search engines that they are using.
Referral – This refers to the external websites that have linked directly to your website. Digging deeper into this section of the report will show the landing pages that external websites are linking to and the names of the referral websites themselves.
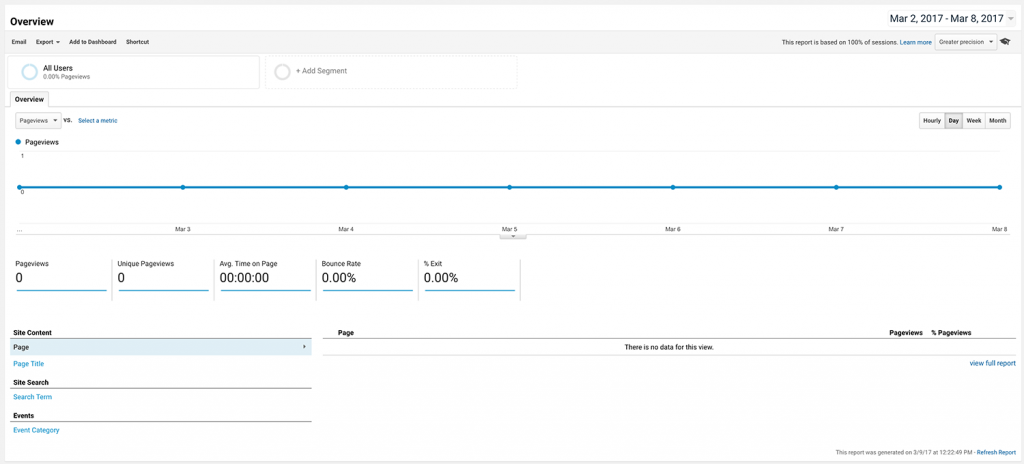
BEHAVIOUR OVERVIEW
The behaviour overview is where you can see your most popular content. The pages are listed in order of highest first and if you are thinking of adding content upgrades to your blog, then be sure to add them to the most popular blog posts first.
I hope this has helped give a basic understanding of Google Analytics. Do you use Google Analytics? What reports do you find most useful?